

This manual provides somewhat more information than is presented in the SAAO polarimeter user's guide. It describes in more detail how on-line reductions are calculated, the optical design, the data and command flow and a description of all the buttons/indicators etc on the GUI.
First time users should first read the user manual and then read this entire manual. More experienced users may want to use the section on the control and data acquisition software as a reference to the functionality of all the GUI's buttons and indicators etc. Users interested in the details of data reduction (including on-line data reduction) should read the section on Optical design and polarimetry. The section on Communications and data flow is more appropriate for someone looking for an introduction into how the instrument works, possibly for development or bug fixing.
This reference manual describes the 2 channel SAAO photo-polarimeter. It contains a high level description of how the instrument works in terms of its optical design, instrument control and its control/data acquisition software.
The optical design is based on the original UCT "single" channel polarimeter designed and built by Mark Cropper in the 1980s. Ignoring various collimating/de-collimating lenses etc, the optical beam first passes through an optional calibration polaroid, followed by rotating (10hz) 1/4 and 1/2 waveplates before being split by a Thompson beam splitter. Each beam then has neutral density, colour filter and aperature wheels. Photon counts are then detected by 2 photomultiplier tubes, one on each channel. There is also an eye-piece and a dark slide on each channel.
Commands to control the instrument are sent from an industrial pc via a PLC (programmable logic controller). The PLC is programmed to control the 2 sets of aperature, colour filter and neutral density wheels, aswell as 2 rotating waveplates, and a polarising calibration wheel. The PLC also relays (upon request) the status of the instrument to the industrial PC via its serial port. Photometer counts (from the 2 photometers), minute and second time pulses (from the SAAO time service) and 1/2+1/4 waveplate pulses (from the waveplates electronics) are received by a SAAO photometry card in an ISA slot of the PC. MT (mean time) and a kilo-hertz signal (from the SAAO time service) are received by an SAAO time card also in an ISA slot of the PC.
The control and data acquisition software is written in C and is hosted by the indsutrial PC. The photometer counts, minute and second time pulses and the 1/2+1/4 waveplate pulses are handled by real time C code in order to ensure correct and absolute timely recording of the data. This is done at 1 milli-second time interval interrupts driven by a 1khz signal from the SAAO time card which in turn is received from an SAAO time service display box. Online data reductions and saving to disk is handled by "normal" C code. The GUI interface is also written in C and uses the xforms libraries.
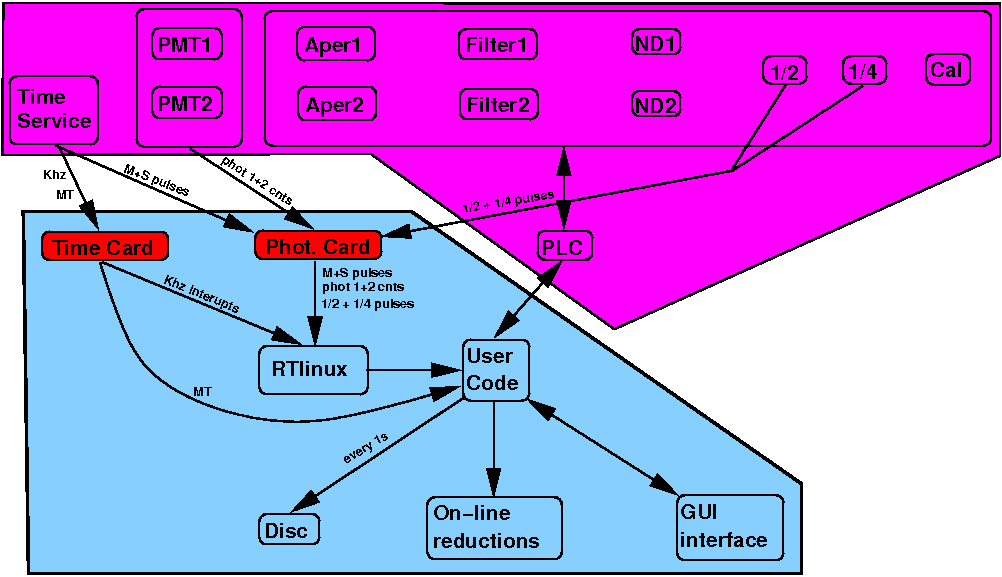
The purple and cyan areas represent the instrument (including the PLC and the time service) and the control PC respectively. The boxes within the cyan area represent various software sub-modules except for the red boxes which represent the photometry and time cards. The arrows show the possible directions of data flow.
The PC uses 3 types of signals/data suplied by the time service. A 1khz signal is sent to a time card on the PC and is used to drive the real time interrupt subroutine. The MT is also sent to the time card and is used by the "normal" c code to record start and end of integrations times etc. The minute/second pulse is fed to the photometry card which is read by the 1khz real time interrupt subroutine.
Two instances of photometer counts are sent to the photometry card which in turn are read by the 1khz interrupt real time subroutine. 1/4 and 1/2 waveplate pulses are also sent to photometry card and their status is read every 100microseconds by a real time periodic subroutine.
The data stream is at a resolution of 1 milli-second. I.e. every milli-second the status of the 2 photo-multiplier tubes, the 2 waveplate pulses, the min/sec pulses and a counter are read. Every 1000 readings (amounting to every 1 second) are saved to file as five columns.
The first 2 columns are the photon counts. These will either display the actual number of counts read in 1 milli-second or will be "XXXX" indicating that the photon counts are most likely garbage due to a changing instrument configuration on that particular PMT channel. The counts are read from 2 of the 4 possible counter ports on the photometer card.
The 3rd and 5th columns indicate the number of 100 microseconds that have passed since the detection of the 1/4 and 1/2 waveplate pulses respectively. The waveplate pulses are 200 microseconds long. They are sent to the photometer card as a TTL input. Therefore they are not interrupt driven and actually have to be read in order to ascertain their status. A resolution of 100 microseconds is sufficient to detect the 200 microsecond pulses. The real time C-code runs a periodic function (every 100 microseconds) to read the TTL input. Upon execution of the function, 2 pulse counters are incremented if pulses are not detected or reset if they are detected. The value of the counters are recorded in coumns 3 and 5. If the waveplates are not rotating and are not stopped at a index position then the counters will increment up to 9999. Hence every 1 milli-second the counters increment by approximately 10 (usually 9). The waveplates rotate at 10hz so the counters should be reset every 100 of the 1 millisecond data points. The waveplate pulses are not synchronised to the millisecond interrupt. Hence the waveplate counters can be recorded (at every 1 millisecond) as anything between 0 and 9 after being reset by the periodic function. In addition the waveplates do not necessarily rotate at exactly 10hz and so there will be some slippage, over time, of the wavepates pulses compared to the millisecond interrupts. Initial estimates amount to a slippage of 1 millisecond every 15-20 minutes. Hence the waveplate counters are used for correct binning of the photon counts w.r.t waveplate positions in order to do polarimetry.
On the same TTL photometry card input as the waveplate pulses, the min/sec pulse from the time card is also read. i.e. bit 1 and 2 are the 1/4 and 1/2 waveplates and bit 3 is the min/sec pulse. The decimal value of this word is recorded in column 4. This is read on the 1 millisecond interrupt and therefore will very rarely catch the waveplate pulses. Therefore this column usually has values of either 0 or 4 and rarely 1 or 2 or 3 or 5 or 6 or 7. Values of 4,5,6 and 7 mean that the min/sec has been detected. The pulses are 0.1 and 0.5 seconds long on the second and minute pulses respectively. Hence the second and minute pulses should give values of 4 (or more) for 100 and 500 consequative data points respectively.
Absolute timeing is thus at the 1 millisecond resolution. The time can be calculated from the recorded MT after the 1000 data points in which the minute pulse occured. The MT is also recorded after the beginning of an integration started by a program.
The 6th column serves as a consistency check that everything has been recorded correctly. It is a simple counter that is reset every 1000.
All commands and status information to/from the PC goes via the PLC.
The HIPPO software gets the SAST from the PC system clock. In turn the PC system clock is set every few minutes against the SAAO time server over the network. A periodic cronjob takes care of this.
The graphical user interface (GUI) of the control software comprises of 5 pages/screens. The screenshot above shows the main screen. Any of the 5 screens can be accessed via the 5 button on the top, left panel. This panel is present on all 5 screens which also displays the current date and time. The displayed time is taken from the SAAO time service and is accurate to the nearest second. The date is taken from the PC clock ......
Control and status of the instrument is from this screen. The 4 other screens are for various on-line data reductions. The instrument can either be controlled manually of via small programs (scripts).
During normal observing all of these boxes should ideally be green.
Pressing on the EXIT box will bring down a pull down confirmation menu. Please do not exit the TCS unless absolutely necessary.
![]()