

This manual is intended to give practical information on how to observe with the HIPPO. It describes how to check and test that everything is working properly, how to operate the instrument and how to make observations.
There is also a reference guide which describes in more detail how on-line reductions are calculated, the optical design, the data and command flow and offline data reductions.
You must visit the telescope on Wednesday afternoon and check things out. The technicians will have attached the polarimeter to the telescope and have done some preliminary connectivity tests. However it is your responsibility to verify that things are working correctly:
Instrument on the telescope.
Dark slides are closed.
Eye pieces are in beam.
PMTs power is off .... unless running dark count and/or noise and/or interference tests.
Hand set on telescope.
If control PC switched off: switch on. Screen goes blank for ~20 secs while it mulls things over.
If at login prompt: login as ccd.
To run the polarimeter software: click on the swirly
icon ![]() at the bottom of the
screen. Restart the software at the begining of everynight. Data is
stored with a file name corresponding to the startup date. If you
forget to restart then the new data will just be appended to the
previous nights data. This is generally not a problem although the
file size can become unmanageable.
at the bottom of the
screen. Restart the software at the begining of everynight. Data is
stored with a file name corresponding to the startup date. If you
forget to restart then the new data will just be appended to the
previous nights data. This is generally not a problem although the
file size can become unmanageable.
If this is the first time the software is run after bootup: exit the software and restart it. There is some permission problem that happens after boot-up only. The software will start first time without problems thereafter.
If you are unfamiliar with the GUI it may be better to read the section "knowing your way around the GUI" first.
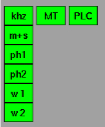
The communications status indicators (above) should all indicate green if all communications channels are OK. If all green then skip the rest of this section.
![]() This is the indicator for
the khz signal between the time service and the time card in the
PC. All the other indicators in the same column below, are
meaningless unless the khz signal is present.
This is the indicator for
the khz signal between the time service and the time card in the
PC. All the other indicators in the same column below, are
meaningless unless the khz signal is present.
The khz signal may
be red ![]() if:
if:
-the cables between the time service and the PC
(time card) are not connected
-the software has not been restarted after boot-up of PC
-something else.....
![]() This is the minute and
second pulse indicator.
This is the minute and
second pulse indicator.
The minute and second pulse signal may be
red ![]() if:
if:
-the cables between the time service and the PC (photometry card) are not connected. These are seperate cables to the khz cables.
-the software has not been restarted after boot-up of PC
-the khz signal is not present
(![]() )
)
-something else.....
![]() and
and ![]() These are the photometer indicators. There
should always be dark counts of ~1-5cs-1.
These are the photometer indicators. There
should always be dark counts of ~1-5cs-1.
If there are 0 cs-1 then
these indicators will turn red ![]()
![]() :
:
-the cables between the instrument and the PC
(photometry card) are not connected.
-the software has not been restarted after
boot-up of PC
-the power supply to the photometers is off
-the khz signal is not present
(![]() )
)
-something else.....
![]() and
and ![]() These are the indicators for the rotating
waveplates pulses'.
These are the indicators for the rotating
waveplates pulses'.
These will turn red ![]()
![]() if:
if:
-you have not yet set the waveplates to rotate
(i.e. they are stopped). Set them rotating in program mode 3.
-the khz signal is not present
(![]() )
)
-the software has not been restarted after
boot-up of PC
-the commications with the PLC are not working
indicated by the PLC indicator being red (![]() )
)
-problem with the indexer on the
instrument. Power cycle the indexer.... has happened a few times
-the waveplates have stalled. i.e. they may
have physically become stuck.... has happened
-the waveplate sensors have malfunctioned
... has happened
-something else.....
![]() This is the time service
indicator.
This is the time service
indicator.
The time service indicator may be
red (![]() ) if:
) if:
-the cables between the time service and the PC
(time card) are not connected. These are seperate cables to the khz
cables and the m+s cables..
-the software has not been restarted after
boot-up of PC
-something else.....
![]() This is the PLC
communications indicator.
This is the PLC
communications indicator.
The PLC communications indicator may be
red (![]() ) if:
) if:
-the cables between the PLC and the PC (serial
port) are not connected.
-the plc is not switched on
-the software has not been restarted after
boot-up of PC
-something else.....
Check that the software is indeed displaying the same time as displayed on the SAAO time server. The date should also be correct. The time according to the PC will not necessary be correct and should be ignored.
At the beginning of every night, or every restart of the software, or every power cycle of anything, initialise everything. I.e. the polarising filters, filter1, filter2, ND1, ND2, Aper1, Aper2. Check that the status indicators report position 0 (in green), and that the Ind and Cen indicators are green.
At the beginning of every night, or every restart of the software, or every power cycle of anything, it is usually necessary to power cycle the indexer. To do this you need to go to the instrument and find the plug labeled "indexer". Switch it off, count to 5, then switch it back on.
Start the waveplates rotating by chossing mode 3 and pressing
GO. The waveplate status indicators should change from yellow
"stopped" to green "running". Also, if they are running correctly, the
waveplate pulses indicators should be green (![]() and
and ![]() ). Also
see "check file saving" below.
). Also
see "check file saving" below.
The photometers are prone to electronic interference that can introduce spurious signals. Two known sources of possible interference are the acquisition camera during readout and/or the rotating waveplates. Proper insulation will illiminate such interference. Counts from both photometers are always reported as cs-1 in their respective boxes on the top right of the main screen irrespective of observing mode and dark counts should be about 1-5cs-1.
Interference from these two sources should be tested individualy. With the waveplates stopped and the acquistion camera reading out (set it to full screen and 0.05s integrations) the dark counts should remain at about 1-5cs-1 with no obvious increase during acquisition camera readout.
Similarly, with the acquistion camera not integrating, start the waveplates rotating and check that the dark counts do not increase.
Note that these tests need to be performed in a dark dome. I.e. the lights are off and the warm room door is closed. Do I need to say that the photometers need to be switched on for these tests?
If you are observing using a "program" data will automatically be saved to disk in /home/ccd/data. The filename will be the date of the day the software was restarted. e.g. if you restarted the software when you came up to the telescope on the evening of Wednesday 1st October 2008 the filename will be 1_10_2008. Data will also be saved to disk if the SAVE button is activated (green) on the main page. This button is mainly used for test purposes. During actual science observing it is best to operate the instrument through the programs menu.
In the meantime activate the SAVE button and ensure the waveplates
are rotating. Then open an xterm and "cd /home/ccd/data". Next type
"tail -n 30 filename (e.g. 1_10_2008)". This command will list the last
30 lines of the data file to the terminal. Repeat the tail command and
note that the data is changing. In particular columns 3 and 5 should
be incrementing (see below). Note that these numbers are periodically
reset upon every rotation of the waveplates and therefore should not
exceed ~950.
0 0 815 0 815 810
0 0 824 0 824 811
0 0 833 0 833 812
0 0 842 0 842 813
0 0 851 0 850 814
0 0 859 0 859 815
0 0 868 0 868 816
0 0 877 0 877 817
0 0 0 0 1 818
0 0 9 0 10 819
0 0 18 0 19 820
Once you are satisfied that this is all correct, keep the
waveplates running for the rest of the night.

1. The top row of buttons/tabs permits the user to switch between the "Main page", "Linear polz", "Int + Circ", "Sky Bufs" and "Pol Bufs" screens. All the work is done in the main screen "Main page". The other screens simply show expanded plots of the online data reductions. Just below these buttons is the "Target name" input field. If no target name is specified then the target name will be recorded as "none". To change the target name, the new name has to be entered into the white input field AND the "Target name" button must be pressed. The current target name is displayed in the box area to the right of the input field. Entering a target name makes later offline data reduction much much easier if you have multiple targets. Data sorting is otherwise a nightmare. To the right of the target name box is the "Manual/Programs" toggle button.
2. The upper left rectangular area (below the
target name input field) is where the user interacts with the
instrument. This has two sub-screens which can be toggled between
using the "Manual/Programs" button. The manual sub-screen is where all
the mechanical parts of the instrument can be individually
controlled. During actual observing this is best done under the
programs sub-screen. However the Manual sub-screen is used for
initialising all the wheels etc at the beginning of the night. Also
the waveplates and the polarising filters (used for calibrations) can
be controlled from the manual sub-screen only. For each of the
mechanisms you must first select what state (from a pull down menu)
you want it to be in. Then press the corresponding "GO" button in
order to issue the command. One important point to remember here is
that the menus in this area DO NOT report the current status of the
instrument: instead they display what command will be sent to the
instrument upon pressing a "GO" button. The current status of the
instrument is reported in the lower left rectangular area of the main
screen.
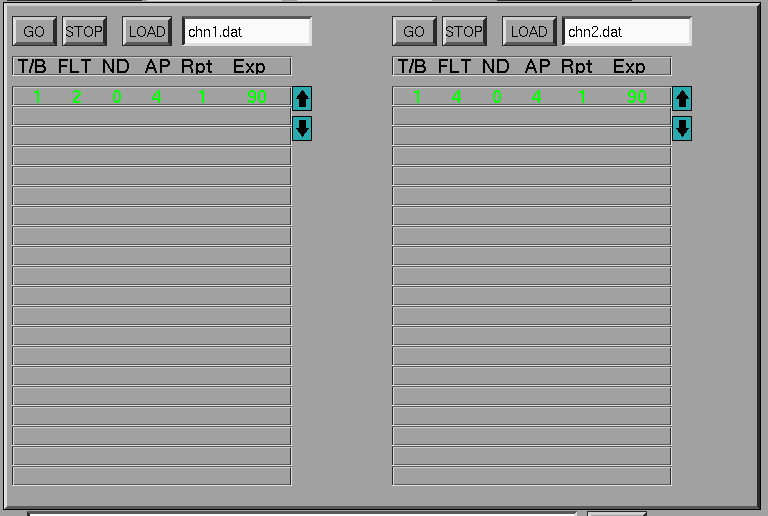
The program sub-screen (above) is where observing programs can be
loaded and executed. This sub-screen is accessed through the
 toggle button. Each
channel has its own program and therefore work independently of each
other. Programs are written as simple ascii files using whatever
editor you like and are saved in /home/ccd/data. Example programs can
also be found in this directory. You must use the format as in the
examples. To load a program: enter the name of the file in the input
field AND press LOAD. A program can have up to 20 lines. The line
currently being executed is highlighted in green whilst the others
remain black. Each of the columns have the following meanings:
toggle button. Each
channel has its own program and therefore work independently of each
other. Programs are written as simple ascii files using whatever
editor you like and are saved in /home/ccd/data. Example programs can
also be found in this directory. You must use the format as in the
examples. To load a program: enter the name of the file in the input
field AND press LOAD. A program can have up to 20 lines. The line
currently being executed is highlighted in green whilst the others
remain black. Each of the columns have the following meanings:
T/B: a 1 or a 0 indicates that this is a Target of a sky
Background exposure respectively. This label is used for online and
offline data reduction.
FLT: This is the filter number position.
ND: This is the neutral density filter number position.
AP: This is the aperture number position.
Rpt: A 1 in this column means to move to and execute the next
line in the program after the current integration. A 0 means to stop
the program at the end of this integration. If the program has 1 line
only (as above) then a 1 in this column means to execute this line
repeatidly until the STOP button is pressed. If the last line in a
multi-line program has a 1 in this column then execution will return
to the first line and start over.
Exp: this is the exposure time in seconds for this line. Note
that every 1 millisecond of data is saved to file irrespective of the
Exp. This then permits arbitary binning of the data during offline
data reductions. Also note that, for above program, there will be a 1
second gap in-between the 90sec exposures. This 1 second is used to
check that the intrument is in the state requested. The online data
reduction plots are updated at the end of the integration.
3. The lower left rectangular area is where the
current status of the instrument is reported. The PLC communications
status indicator must be green (![]() ) for the status to be "live". If the PLC communications
status indicator is red (
) for the status to be "live". If the PLC communications
status indicator is red (![]() ) then the reported instrument status is not being updated
and is probably incorrect. Except for the waveplates, each of the
mechanisms has 3 types of status indicators: Pos, Ind and Cen.
) then the reported instrument status is not being updated
and is probably incorrect. Except for the waveplates, each of the
mechanisms has 3 types of status indicators: Pos, Ind and Cen.
![]() reports the current
POSITION of a particular mechanism and is generally a number anywhere
in the range 0-8. This indicator will also turn red if the mechanism
is moving or green when stationary.
reports the current
POSITION of a particular mechanism and is generally a number anywhere
in the range 0-8. This indicator will also turn red if the mechanism
is moving or green when stationary.
![]() (short for index)
indicators are green when a mechanism is in position 0 and grey when
not. Poistion 0 is the only absolutely encoded position, whereas the
other positions rely on the software keeping count of the current
position. Initialisation of each mechanism will tell the instrument to
seek out position 0.
(short for index)
indicators are green when a mechanism is in position 0 and grey when
not. Poistion 0 is the only absolutely encoded position, whereas the
other positions rely on the software keeping count of the current
position. Initialisation of each mechanism will tell the instrument to
seek out position 0.
![]() (short for centered)
indicates that a particular mechanism is centered on a position. It
will turn red if not centered which may happen if a mechnaism gets
stuck halfway between 2 positions for example.
(short for centered)
indicates that a particular mechanism is centered on a position. It
will turn red if not centered which may happen if a mechnaism gets
stuck halfway between 2 positions for example.
The waveplates (1/2 and 1/4) can be in 1 of 3
states. i.e. running, stopped or stalled. A stalled state is an error
state. There is also a system ok/not ok indicator. This will report an
error if any of various electronic circuitory don't behave as
expected. "Wave mode" can be either one of 0,1,2 or 3. So far only
the all-Stokes mode has been fully commissioned/tested although there
is no reason why the other modes will not work. However the data
reduction software has yet to be tested and/or tweaked for the other
modes.
4. The plots area (right half) is where the live
photon counts are reported and online data reductions are
displayed. There are two columns of plots each corresponding to the 2
channels (photometers).
-The upper two plots display the counts rates in
cs-1. Input fields permit scaling of the Y axis and the time
axis. Equalising the lower and upper Y values will force
auto-scaling. The counts are also reported numerically at the top of
the GUI. The adjacent boxes display the time of the current
integration. These boxes are green during integrations (and therefore
data saving) and red if integrations are not in progress. The P button
toggles plotting on/off (green/grey)![]() /
/![]() . This is
usefull when not integrating but you wish to see the counts
graphically e.g. when drift scanning. It is best to switch this off
when integrating so that the polarimetry calculations are not updated
every second but instead at the end of every integration.
. This is
usefull when not integrating but you wish to see the counts
graphically e.g. when drift scanning. It is best to switch this off
when integrating so that the polarimetry calculations are not updated
every second but instead at the end of every integration.
-The middle two plots display the polarised buffers. There
are 100 bins along the x-axis with 0-99 corresponding to 1 complete
rotation of the 2 waveplates. Counts will accumulate in the bins until
the end of an integration upon which they will be reset to 0. The
y-axis is autoscaled between the minimum and maximum values. The green
points are the actual data and the yellow curve is the best fit of the
polarisation function that gives the polarisation.
-The buttons/boxes in between the middle and lower plots
display the polarised measurements and their errors. The measurements
are updated every second unless the exp button is toggled on (green) in
which case it will only be updated at the end of the current
integration. This does not effect the update of the plots which are
updated at the end of the current integration unless
the ![]() is on. Each measuremnt
(Lin, PA and Cir) are also buttons. The active one is displayed in
green and displayed in the lower plot.
is on. Each measuremnt
(Lin, PA and Cir) are also buttons. The active one is displayed in
green and displayed in the lower plot.
-The lower two plots display the polarimetry
measurements. The plot can be changed between Lin, PA, or Cir by using
the buttons above the plots. The green points are the data whilst the
yellow points demarcate the error measurement.
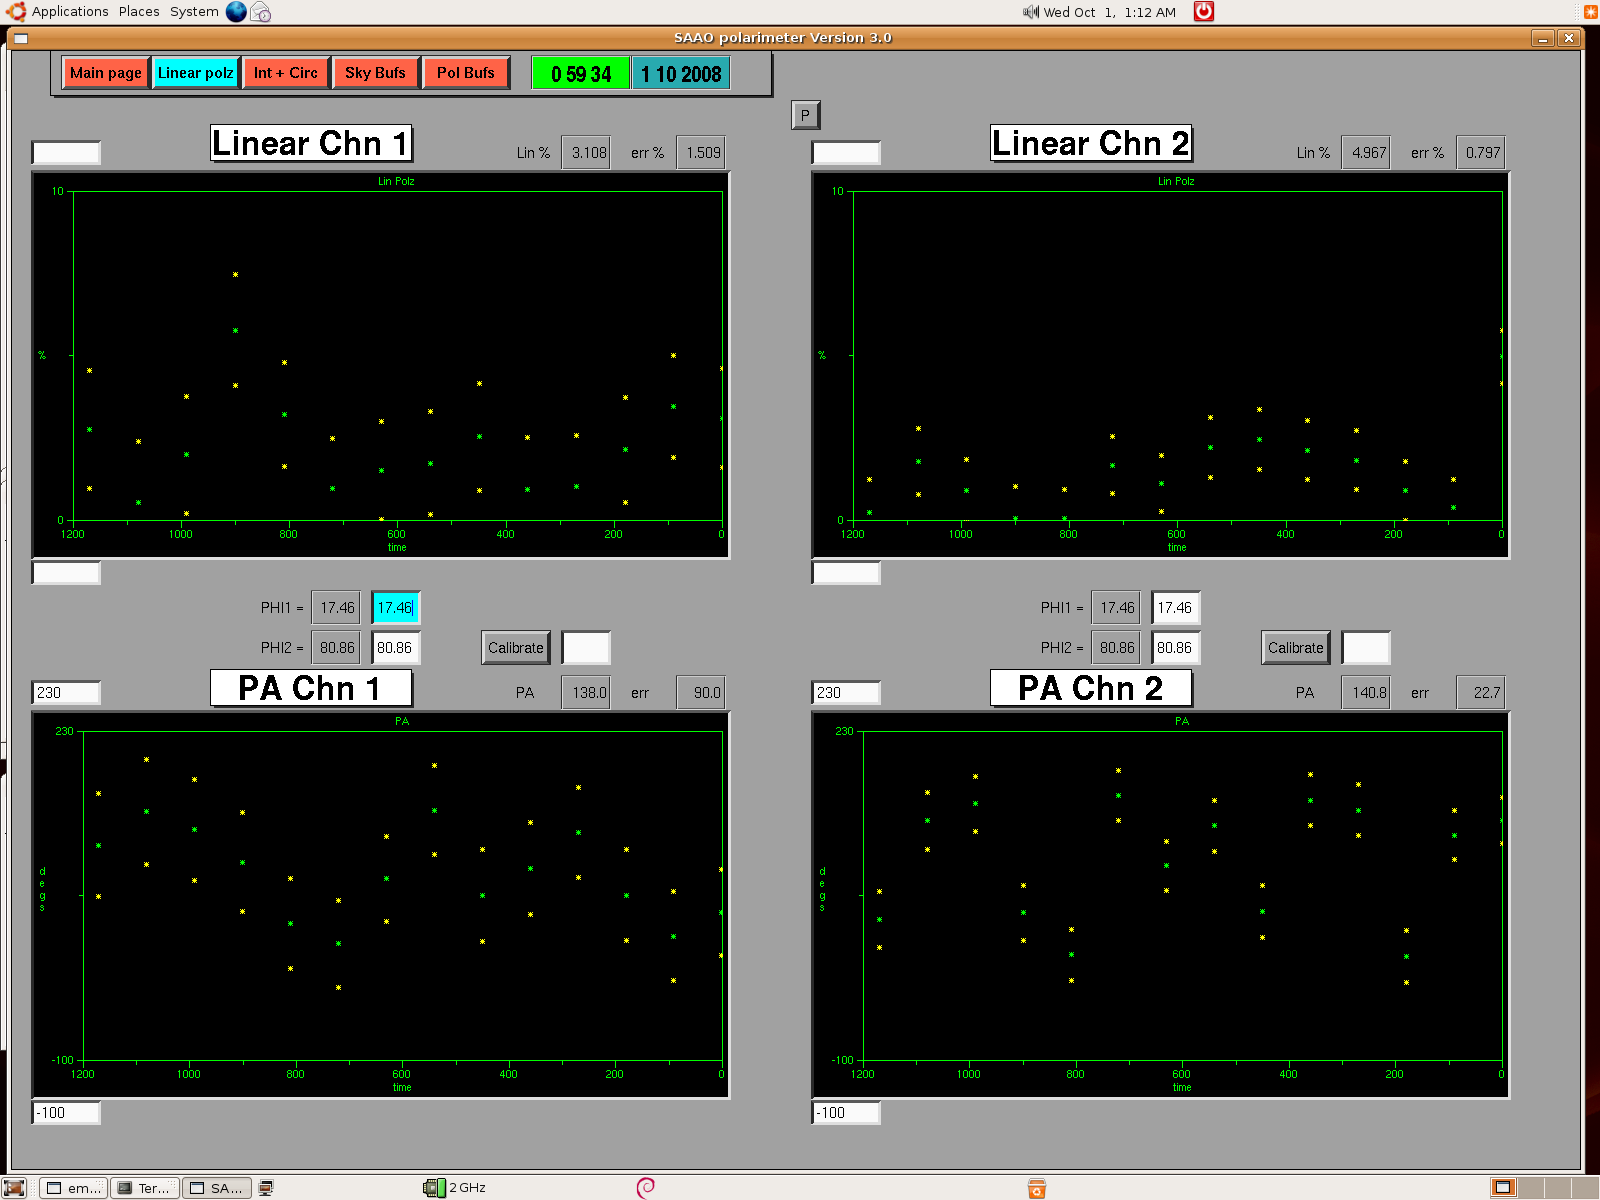
This page serves to give an enlarged view of the online linear polarisation and position angle data reductions. Input fields permit scaling of the Y-axis.
![]() Most
importantly this page is where the waveplate offsets can be either
specified or calibrated. Proper online data reduction requires the
waveplate zeropoints to be known. These can be calibrated by observing
a polarized standard star. Whilst observing the star, the angle of
polarisaion (of the star) can be entered into the input field and
calibrate pressed to on (green). This will force the online data
reduction routine to calculate the waveplate zero points that give the
correct angle of polarisation. Once these have been calculated you
must switch off the calibrate to fix the waveplate zero points.
Most
importantly this page is where the waveplate offsets can be either
specified or calibrated. Proper online data reduction requires the
waveplate zeropoints to be known. These can be calibrated by observing
a polarized standard star. Whilst observing the star, the angle of
polarisaion (of the star) can be entered into the input field and
calibrate pressed to on (green). This will force the online data
reduction routine to calculate the waveplate zero points that give the
correct angle of polarisation. Once these have been calculated you
must switch off the calibrate to fix the waveplate zero points.
This page serves to give an enlarged view of the live intensity and circular polarisation online data reductions. Input fields permit scaling of the Y-axis. Self explanatory ... no need to show figure.
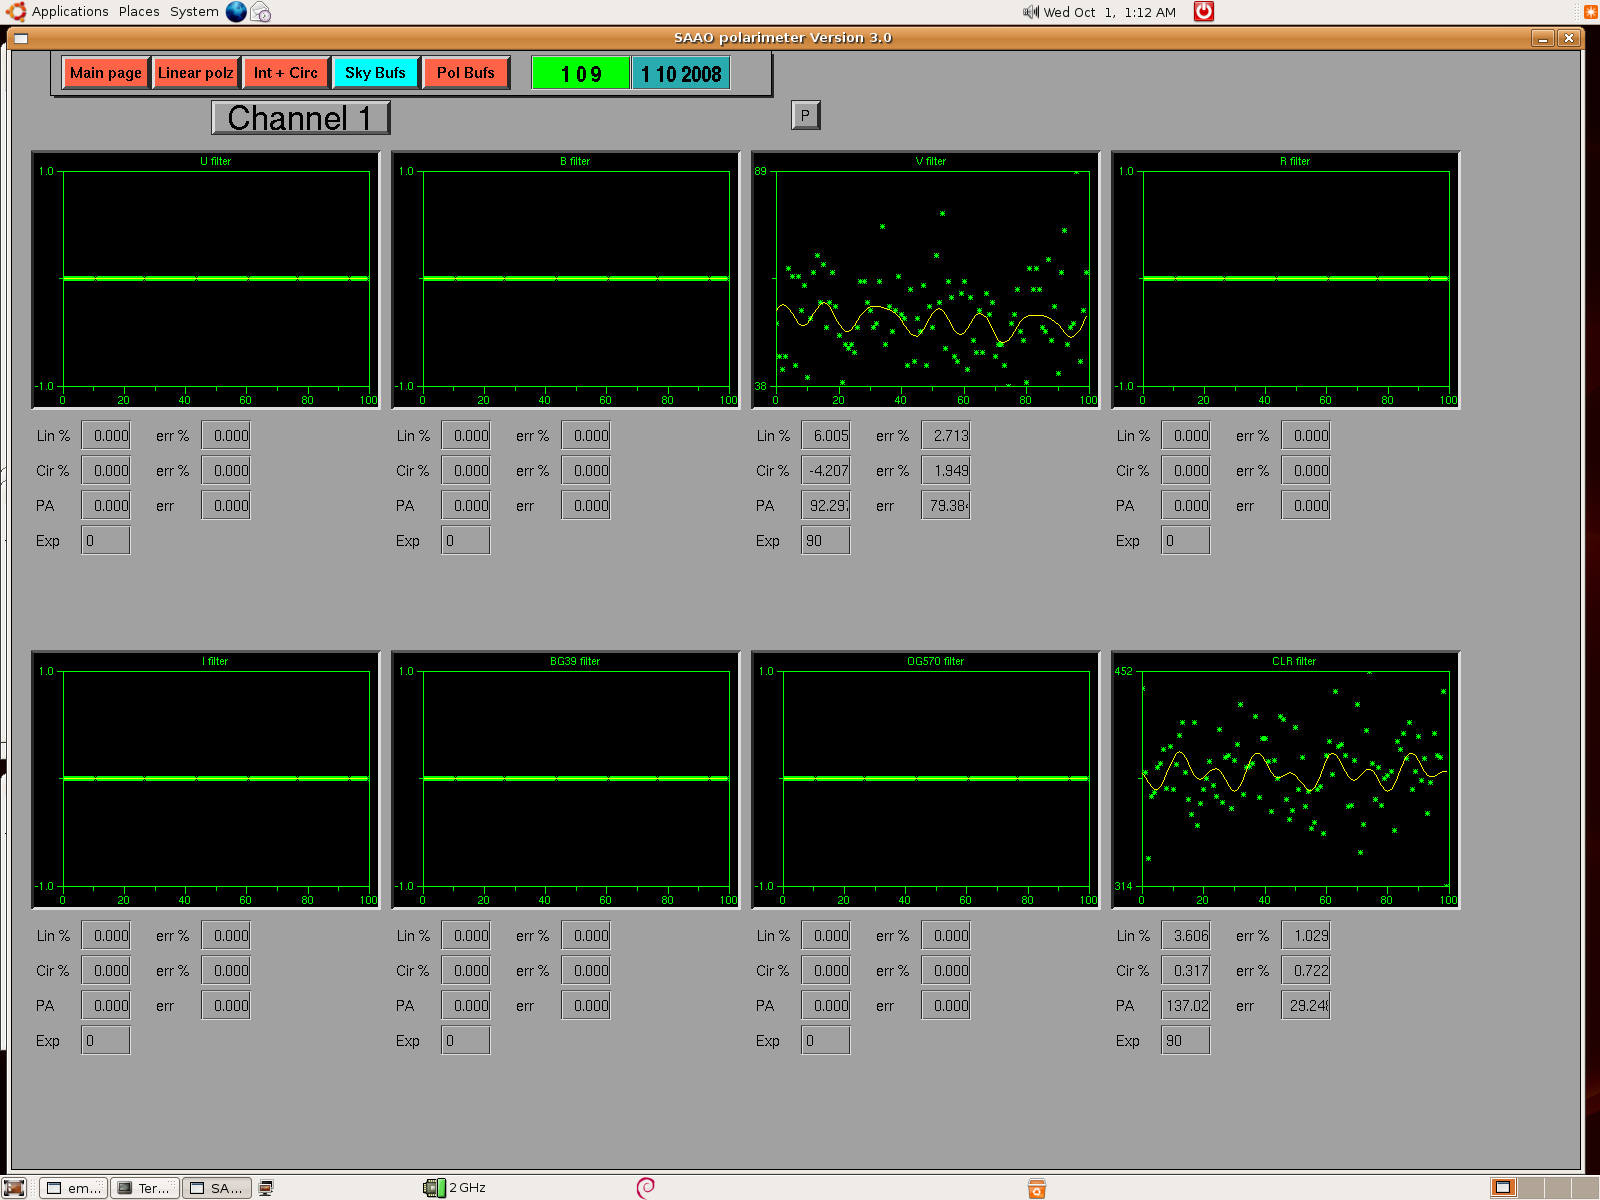
This page displays the sky polarisaton buffers and the calculated sky polarization. There are separate buffers for each filter and each channel. Only one channel is displayed at any one time and the two channels can be toggled between via the Channel 1/2 button. Each buffer records the previous sky measurement and thus a new sky integration will overright the current sky buffer. In the figure above, sky measurements for the clr and v filter have been made only.
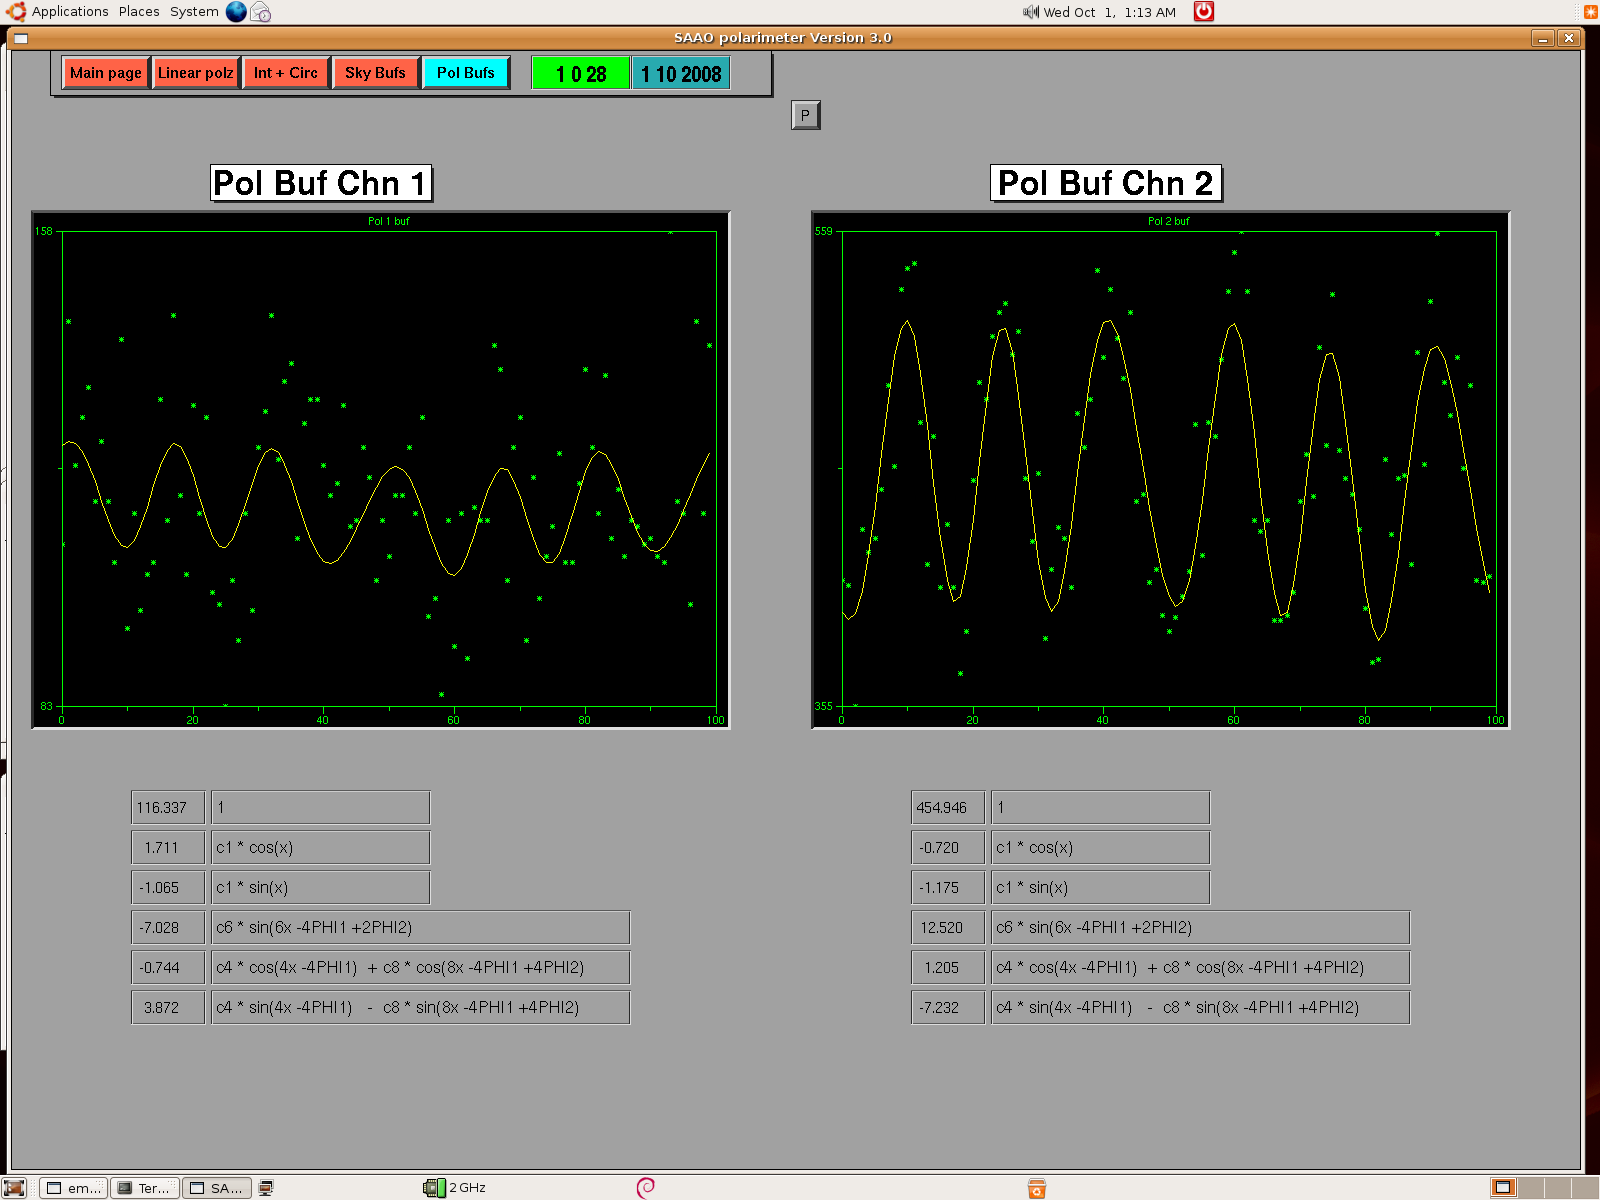
This page serves to give an enlarged view of the live polarisation buffers. The green points are the data and the yellow curves are the best fit of the polarisation function that gives the polarisation. The terms of the polarisation function and their factors are displayed below the plots.